A line graph may be used to show trends and how data
changes over time. Every line graph has a
Title at the top. Each line graph also has a
Vertical Axis (side) and a
Horizontal Axis (side). The vertical
axis is called the Scale. The Scale is
the up-and-down number line on the graph. The line graph below has
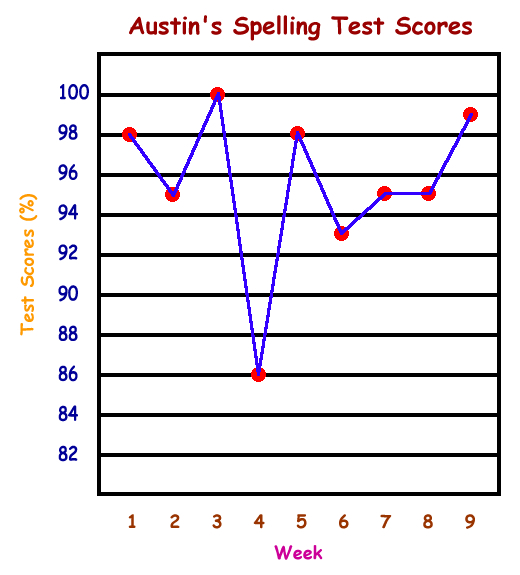
Test Score percentages listed on the vertical axis. The horizontal
axis on a line graph goes left-to-right. The graph below lists Weeks
1 through 9 on the horizontal axis.
Let's look at how to read a line graph. Put your
finger over the first red point
on the graph below. Move your finger left along the black line and you should run into the number
98. This point means 98%. Now go back to the first red point again and move your
finger all the way straight down. You
should run into Week 1. This first red point means that Week 1
Austin's Spelling Test score was 98%.
What if Austin's score was 97%? This isn't shown
on the graph below but if it were shown, the red point would have been
placed between the numbers 96 and 98. A test score of 97%
would not sit directly on a black line but instead it would float between
the lines of 96 and 98.
Now it's time for you to try some on your own.
Answer the questions below the graph.
1. What was Austin's test score Week 2?
%
2. What was Austin's test score Week 3?
%
3. What was Austin's test score Week 4? %
4. What was Austin's test score Week 5? %
5. What was Austin's test score Week 6?
%
6. What was Austin's test score Week 7?
%
7. What was Austin's test score Week 8?
%
8. What was Austin's test score Week 9?
%
9. Which week did Austin have the best spelling
test score? Week
10. Which week did Austin have the lowest spelling
test score? Week
11. What is the difference between Weeks 1 and 6? %
12. What is the difference between Weeks 3 and 4? %
13. What happened to Austin's score from Week 2 to
Week 3?
A.
His score went down.
B.
His score went up.
C.
His score stayed the same.
14. What happened to Austin's score from Week 5 to
Week 6?
A.
His score went down.
B.
His score went up.
C.
His score stayed the same.
15. What happened to Austin's score from Week 7 to
Week 8?
A.
His score went down.
B.
His score went up.
C.
His score stayed the same.
Elementary & Middle School Lessons & Self-Correcting Tests for Children in all Subject Areas. If you have found an error or would like to make comments on this lesson,
please email us at:
MySchoolhouse.online@gmail.com
Copyright 1999-2024 by Educational Designers, LLC. All rights reserved. Lessons & Tests in Math, Reading, Spelling, Science, Language, and Social Studies.
"This site uses cookies from Google to deliver its services and analyze
traffic. Your IP address and user-agent are shared with Google along with
performance and security metrics to ensure quality of service, generate
usage statistics, and to detect and address abuse."