A bar graph is a graph that uses bars to show data.
Bar length is important. The highest or longest bar has the most.
The smallest or shortest bar has the least or fewest. Every
bar graph has a Title at the top that tells you what the graph is
about.
Bar graphs may be vertical or horizontal.
Vertical means up and down. Horizontal means across or left to right.
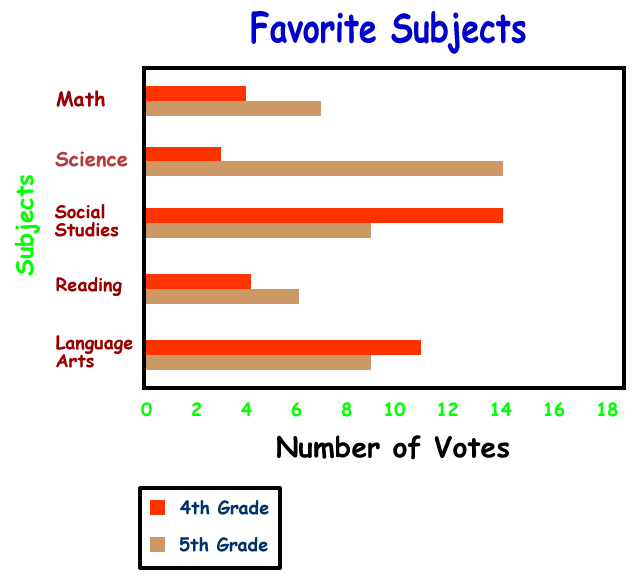
In the bar graph below, you will see two different colored
bars. This is called a double bar graph. Double bar
graphs are used for comparing data.
Every bar graph has a Scale, which are the numbers listed on one
axis (side or bottom) of
the graph. In the graph below, the Scale (Number of Votes) is on the
horizontal axis. The other axis on the graph below lists the
Subjects and is called the vertical axis. Note: The Scale
could be switched around so that it would be on the vertical axis and then
the Subjects would be listed on the horizontal axis.
The horizontal double bar graph below uses a Scale of two.
This means the numbers in the Scale count by two (2, 4, 6, 8, 10 and so on).
Be careful when the bar ends between two numbers.
If the bar ends between 4 and 6,
then the answer is 5.
If the bar ends between 8 and 10
then the answer is 9.
Look at the graph below and answer the questions
that follow.
1. How many students in 4th grade chose Math as
their favorite subject?
2. How many students in 5th grade chose Math as
their favorite subject?
3. How many students in 4th grade chose Science as
their favorite subject?
4. How many students in 5th grade chose Science as
their favorite subject?
5. How many more students in 5th grade like
Science than in 4th grade?
6. How many students in 4th grade said Social
Studies is their favorite?
7. How many students in 5th grade said Social
Studies is their favorite?
8. How many more students in 4th grade like Social
Studies than in 5th grade?
9. How many students in 4th grade chose Language
Arts as their favorite?
10. How many students in 5th grade chose Language
Arts as their favorite?
11. How many more students in 4th grade like
Language Arts than in 5th grade?
12. What was the most popular subject in 4th
grade?
13. What was the most popular subject in 5th
grade?
14. Of either grade, which subject received the
fewest votes?
15. What is the Title of the graph?
Number of
Votes
Favorite
Subjects
Subjects
16. What is the Scale label on this graph?
Favorite
Subjects
Subjects
Number of
Votes
17. What kind of graph is above?
Horizontal Bar Graph
Horizontal Double Bar Graph
Vertical Double Bar Graph
Vertical Bar Graph
18. The Number of Votes label is on
the
Vertical
axis.
Horizontal
axis.
19. How many students voted for favorite subject
in 4th grade?
20. How many students voted for favorite subject
in 5th grade?
Elementary & Middle School Lessons & Self-Correcting Tests for Children in all Subject Areas. If you have found an error or would like to make comments on this lesson,
please email us at:
MySchoolhouse.online@gmail.com
Copyright 1999-2024 by Educational Designers, LLC. All rights reserved. Lessons & Tests in Math, Reading, Spelling, Science, Language, and Social Studies.
"This site uses cookies from Google to deliver its services and analyze
traffic. Your IP address and user-agent are shared with Google along with
performance and security metrics to ensure quality of service, generate
usage statistics, and to detect and address abuse."